In many infrastructures it is possible that we need to control the performance of a computer or server.
Performing this task manually is very complicated as we will most likely have to use several different tools, one to control each aspect (processor/memory/networking/ and a long etc.) of the computer. Therefore, it is best to use resource monitors such as Netdata.
What is Netdata?
Netdata is a free and open source application developed to offer users a real-time monitor of the performance of a Linux system as well as the state of the system applications and different services such as SNMP.
This tool runs as a daemon in the system to be able to offer at all times information about the state of the system and its applications and services, both in real time and information on the state in the past.
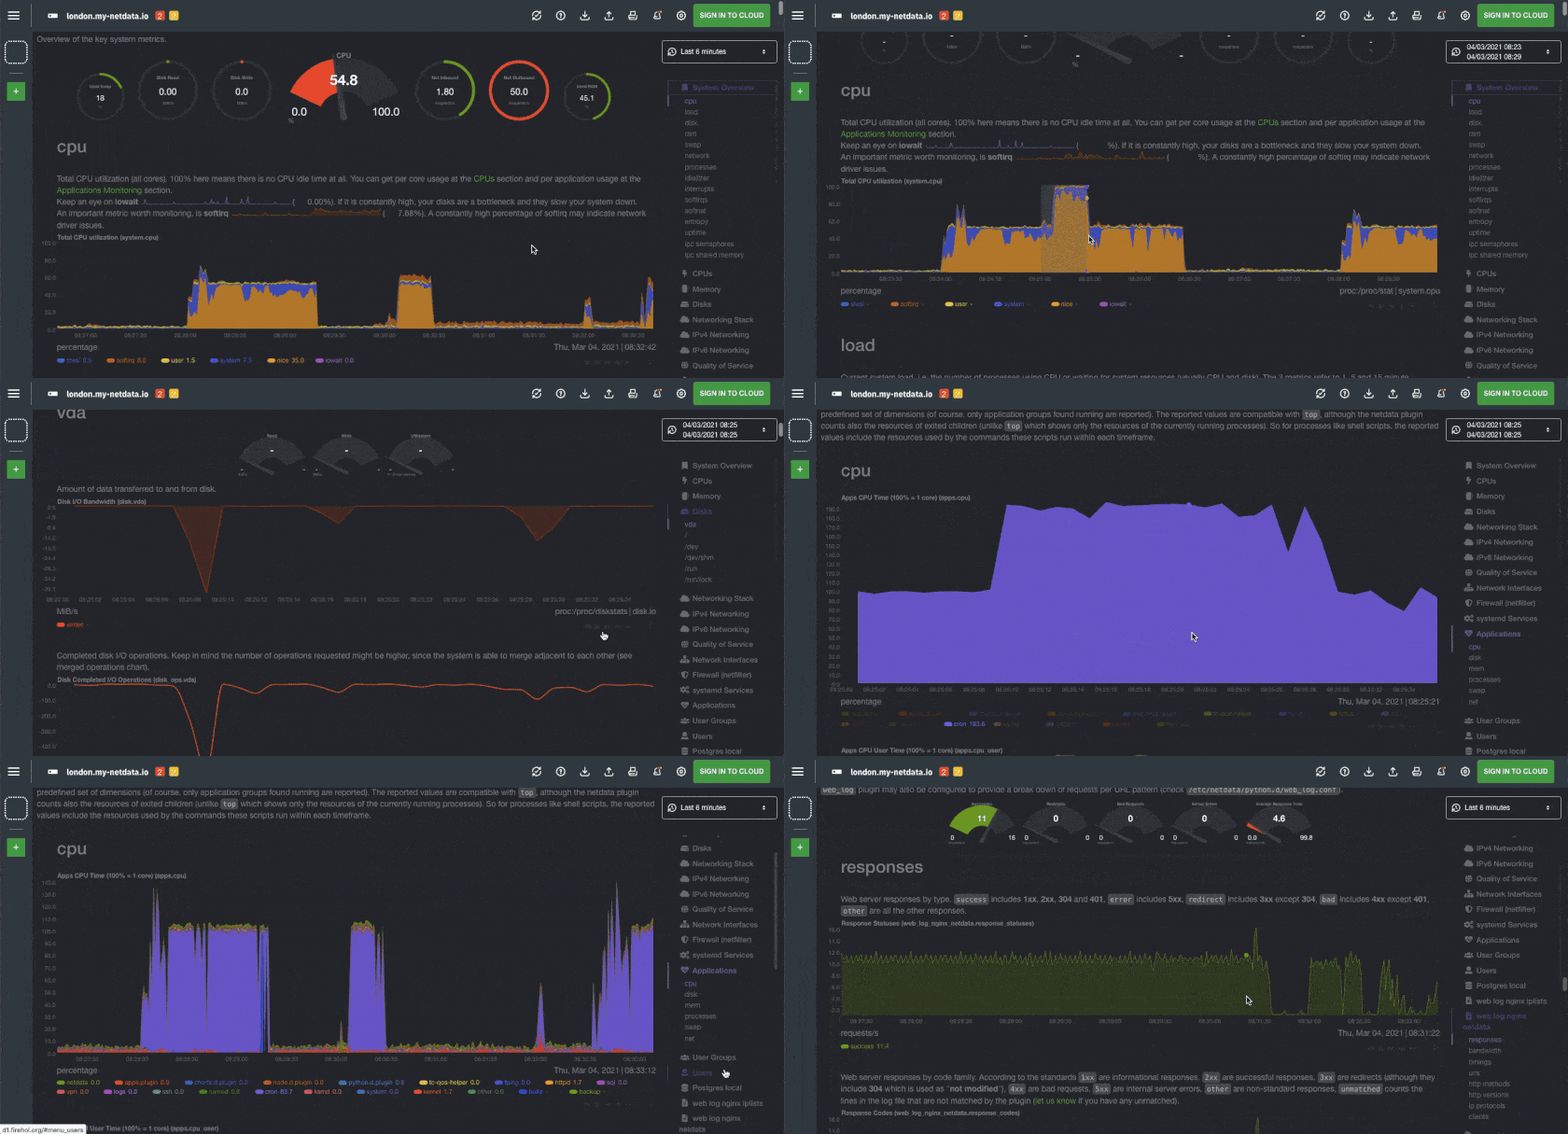
The main features of this resource monitor are:
- A nice tool in sight.
- Fully customizable interface using HTML language (no JavaScript required).
- Written in C, it is a very fast and efficient tool.
- It consumes only 2% of a processor core and a few MB of RAM.
- It does not require any configuration, everything is detected automatically.
- It has no dependencies.
- Modular. We can add more functions using plug-ins.
- It can run on any Linux kernel.
Because this tool does not require any configuration, by default it will allow us to monitor and obtain information in real time on the following elements:
- CPU usage and status.
- Use of RAM and Swap.
- Hard Disks Usage
- Activity of the network interfaces.
- Status of IPv4 connections.
- Netfilter / Iptables activity.
- List of processes and demons.
- NFS server status.
- Real-time network QoS monitor.
- Applications executed.
- Status of the Apache Web server.
- NginX web server status.
- State of the MySQL databases.
- ISC BIND server status.
- Status of the mail server.
- Squid proxy status.
- Hardware sensors (temperatures, voltages, fans, etc).
- UPS / UPS control.
As we have said, Netdata is an open source application, so we can get more information about it through GitHub. Here we will also find a series of manuals to compile and install the tool, as we will see below.
How to install Netdata on Ubuntu
Prerequisites
- One Ubuntu server set up, including a sudo non-root user and a firewall.
- Git installed on your server
To setup this application, the first thing to do is to install the necessary dependencies in our system. To do this, simply open a terminal and run:
# basic netdata installation
bash <(curl -Ss https://my-netdata.io/kickstart.sh)

# or

# install required packages for all netdata plugins
bash <(curl -Ss https://my-netdata.io/kickstart.sh) all
This script will begin to compile and install the application automatically without us having to intervene in the process. It will also inform us of the path where each of the components of the tool will be installed.
It will be installed at these locations:
– the daemon at /usr/sbin/netdata
– config files in /etc/netdata
– web files in /usr/share/netdata
– plugins in /usr/libexec/netdata
– cache files in /var/cache/netdata
– db files in /var/lib/netdata
– log files in /var/log/netdata
– pid file at /var/run/netdata.pid
– logrotate file at /etc/logrotate.d/netdata
Run Netdata in browser
Finally, to start monitoring the application, we simply have to access the IP of our computer through HTTP by the port 19999. For example:
http://localhost:19999
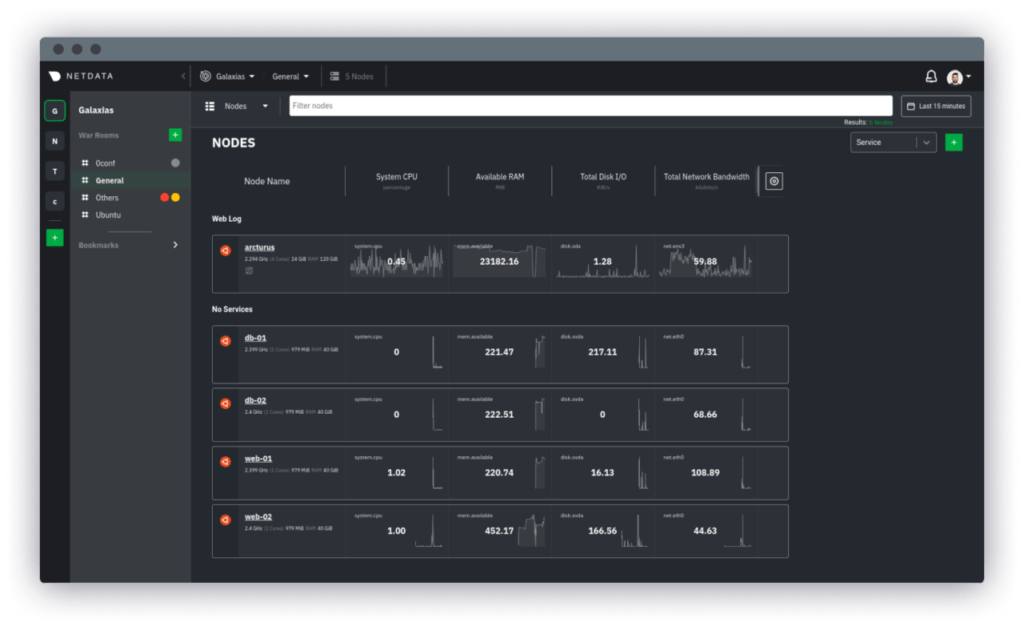
Netdata needs no extra configuration necessary once installed, but provides significant customization. The efficiency and speed of the application aims to be comparable to native console administration tools such as vmstat, iostat and htop.

